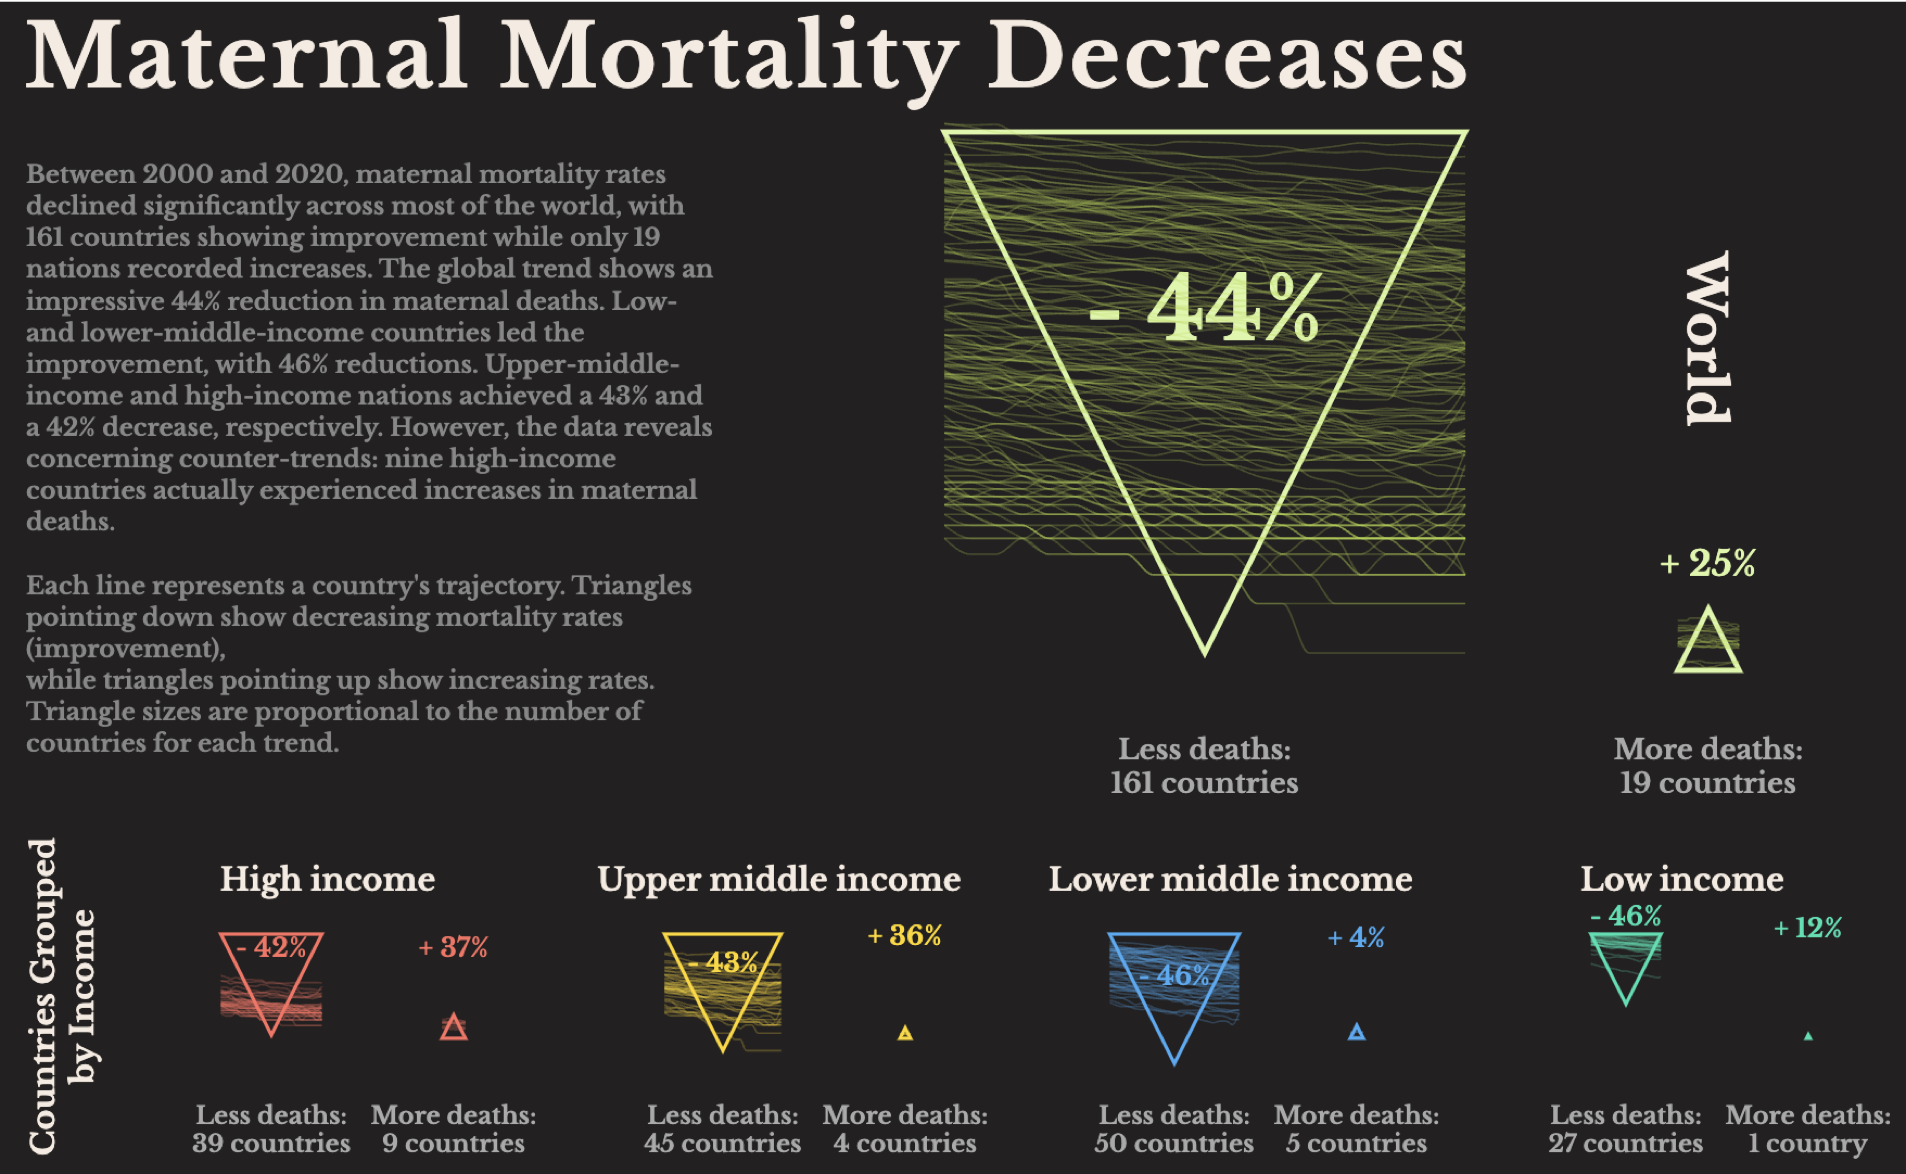
Maternal Mortality Trends
An interactive exploration of global maternal health outcomes across different regions, highlighting disparities and improvements over time.
View Project →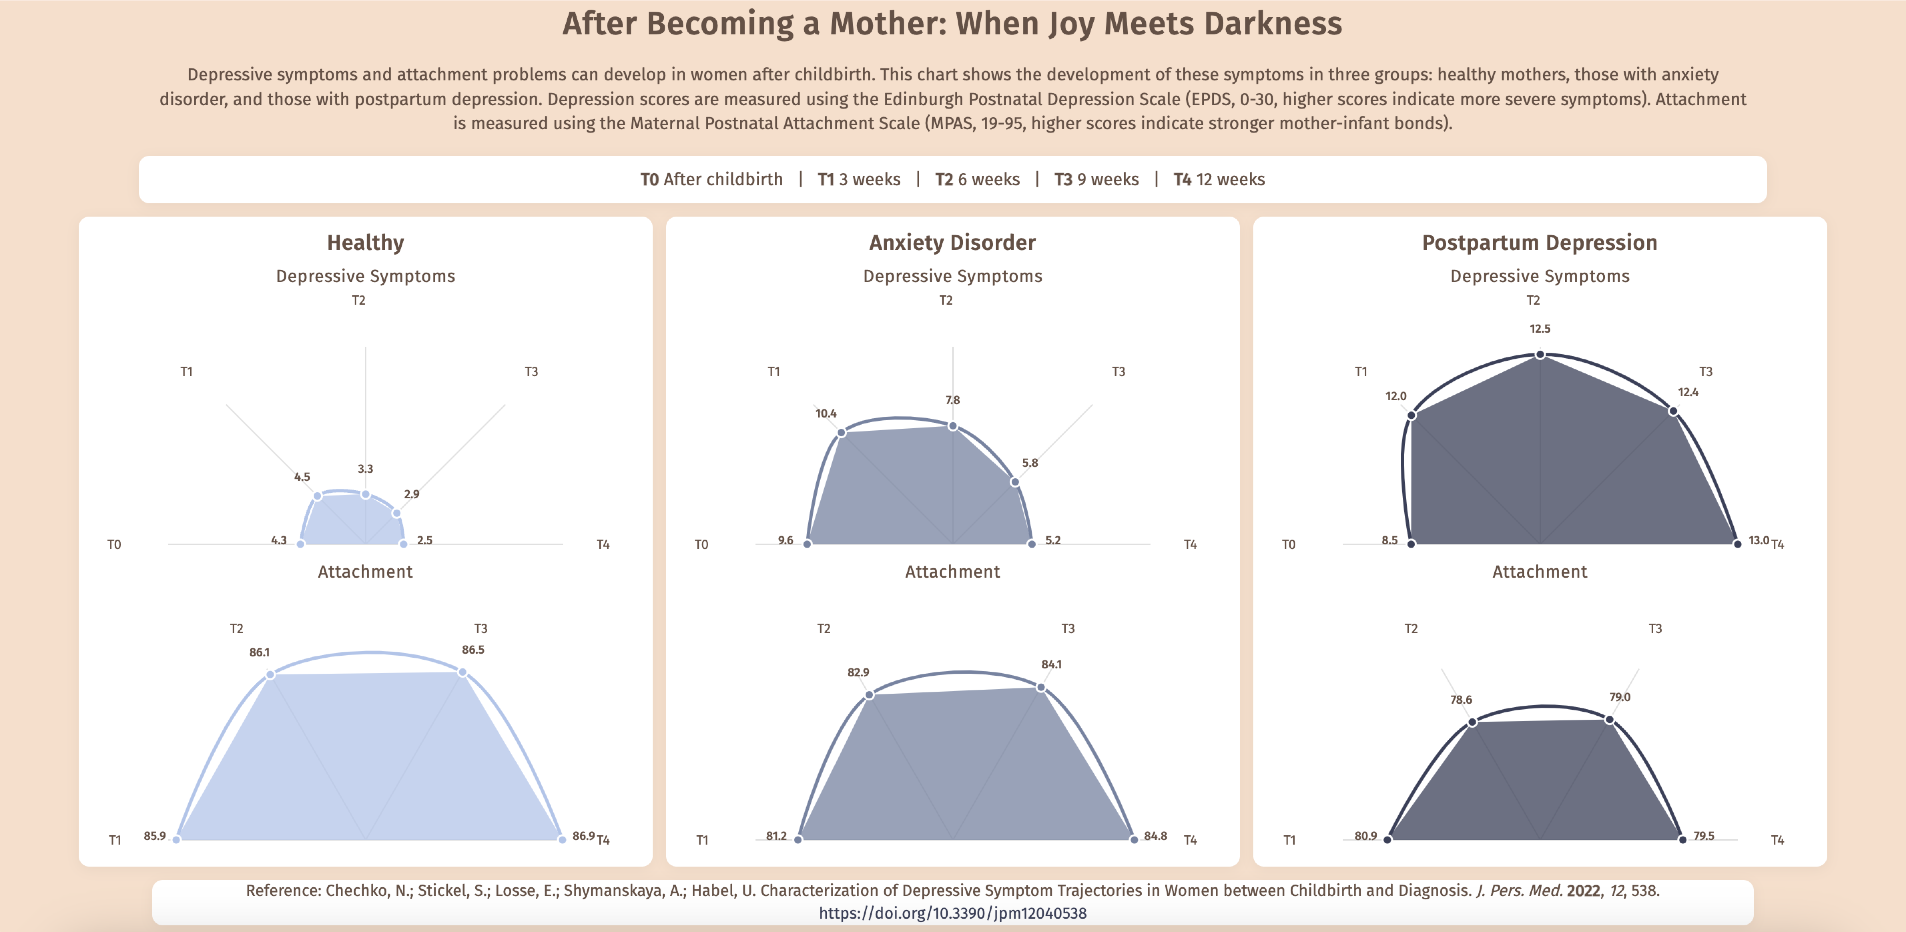
After Becoming a Mother: When Joy Meets Darkness
Depressive symptoms and attachment problems can develop in women after childbirth. This chart shows the development of these symptoms in three groups: healthy mothers, those with anxiety disorder, and those with postpartum depression.
View Project →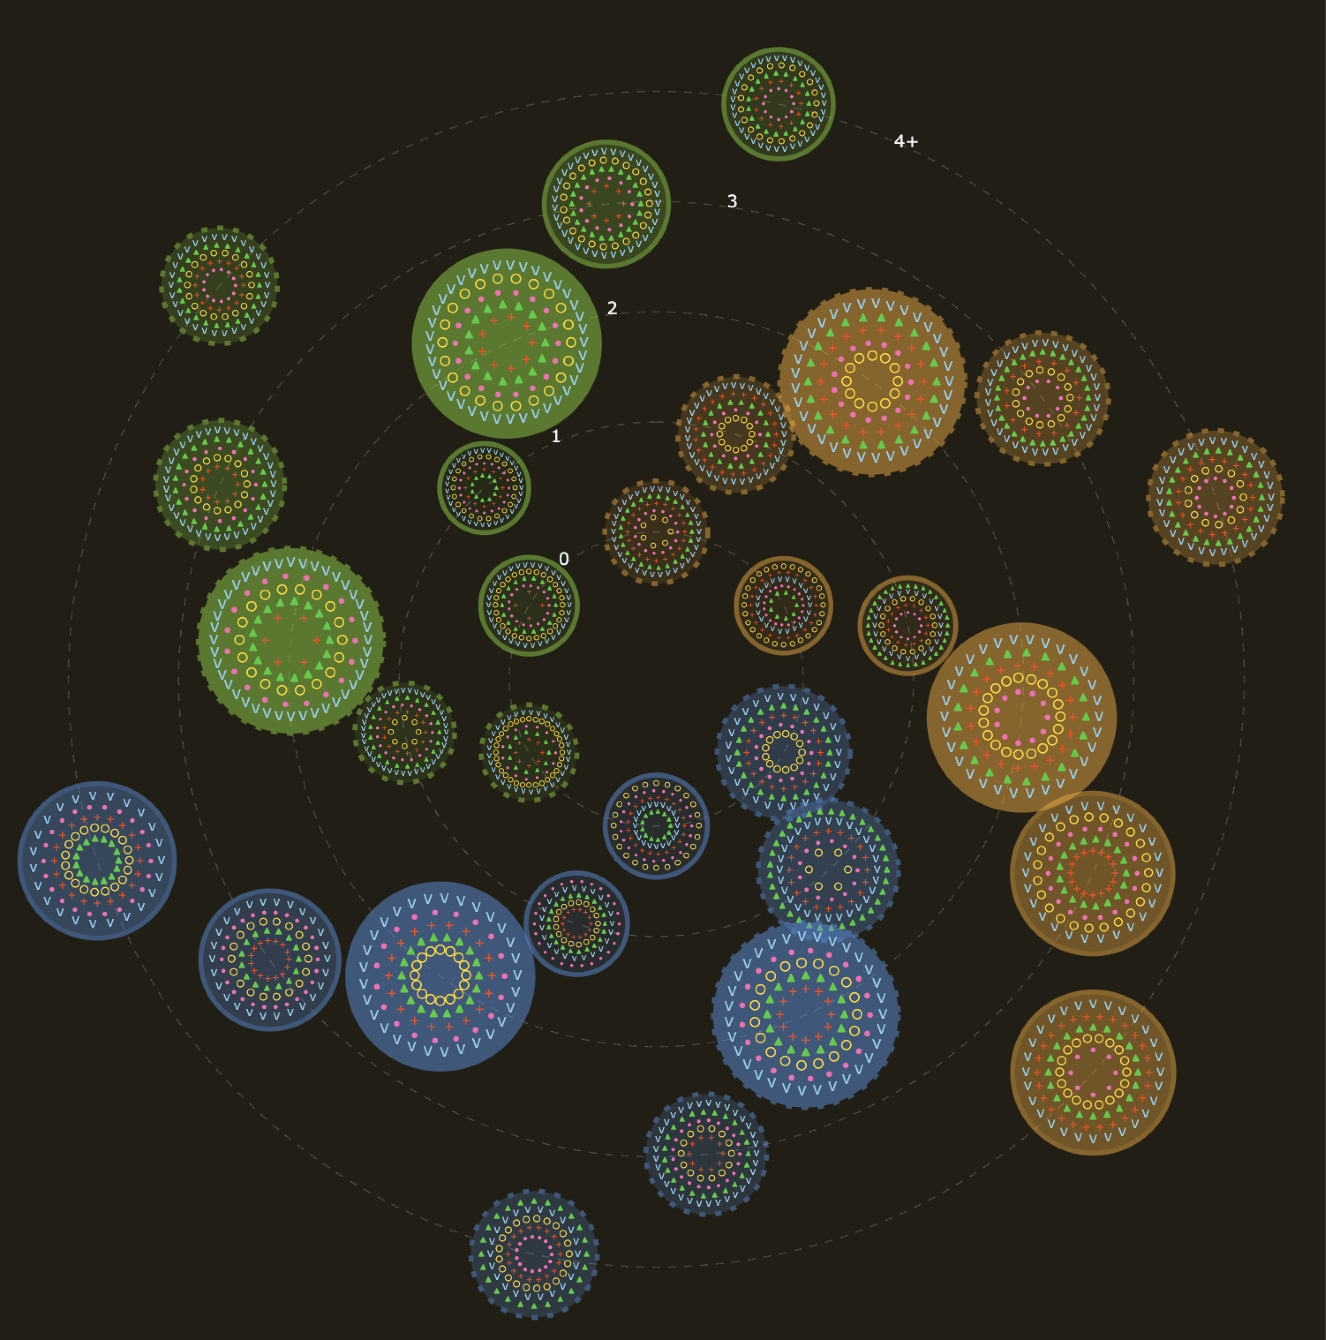
Family Size Patterns
Analysis of family size expectations versus reality in the USA.
View Project →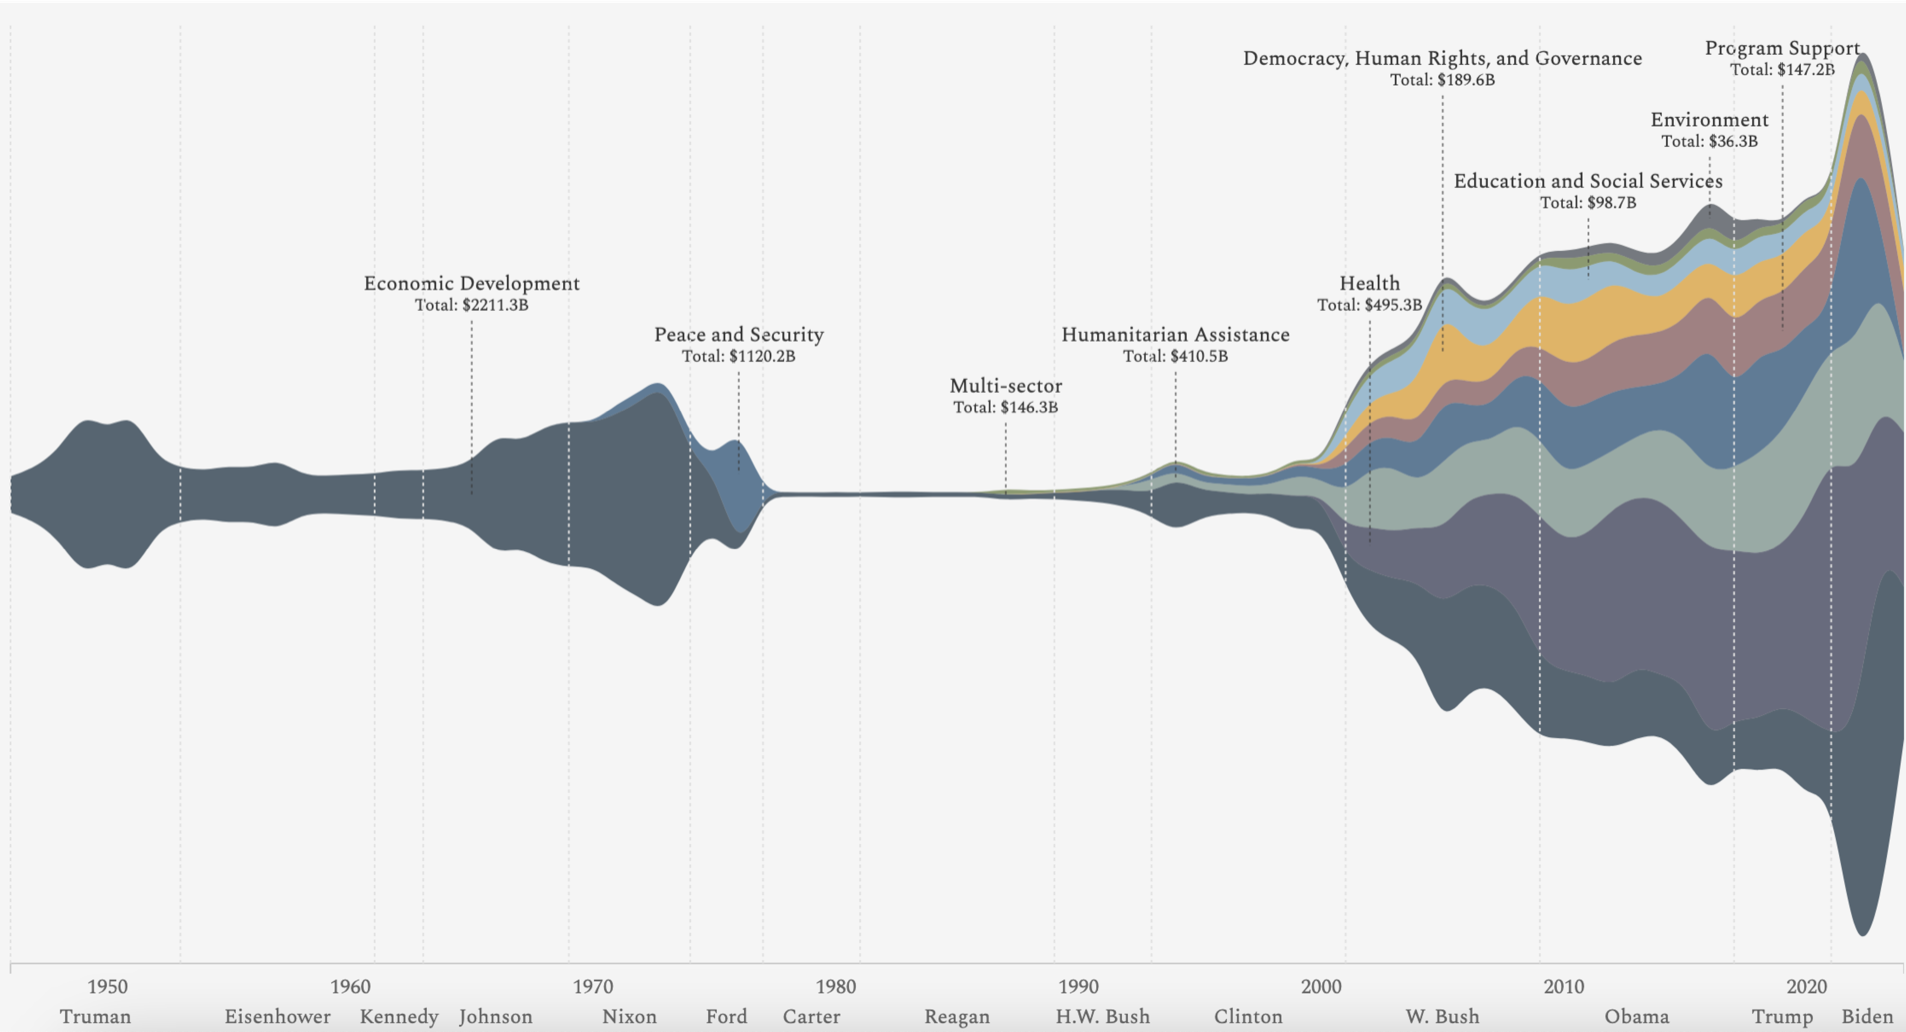
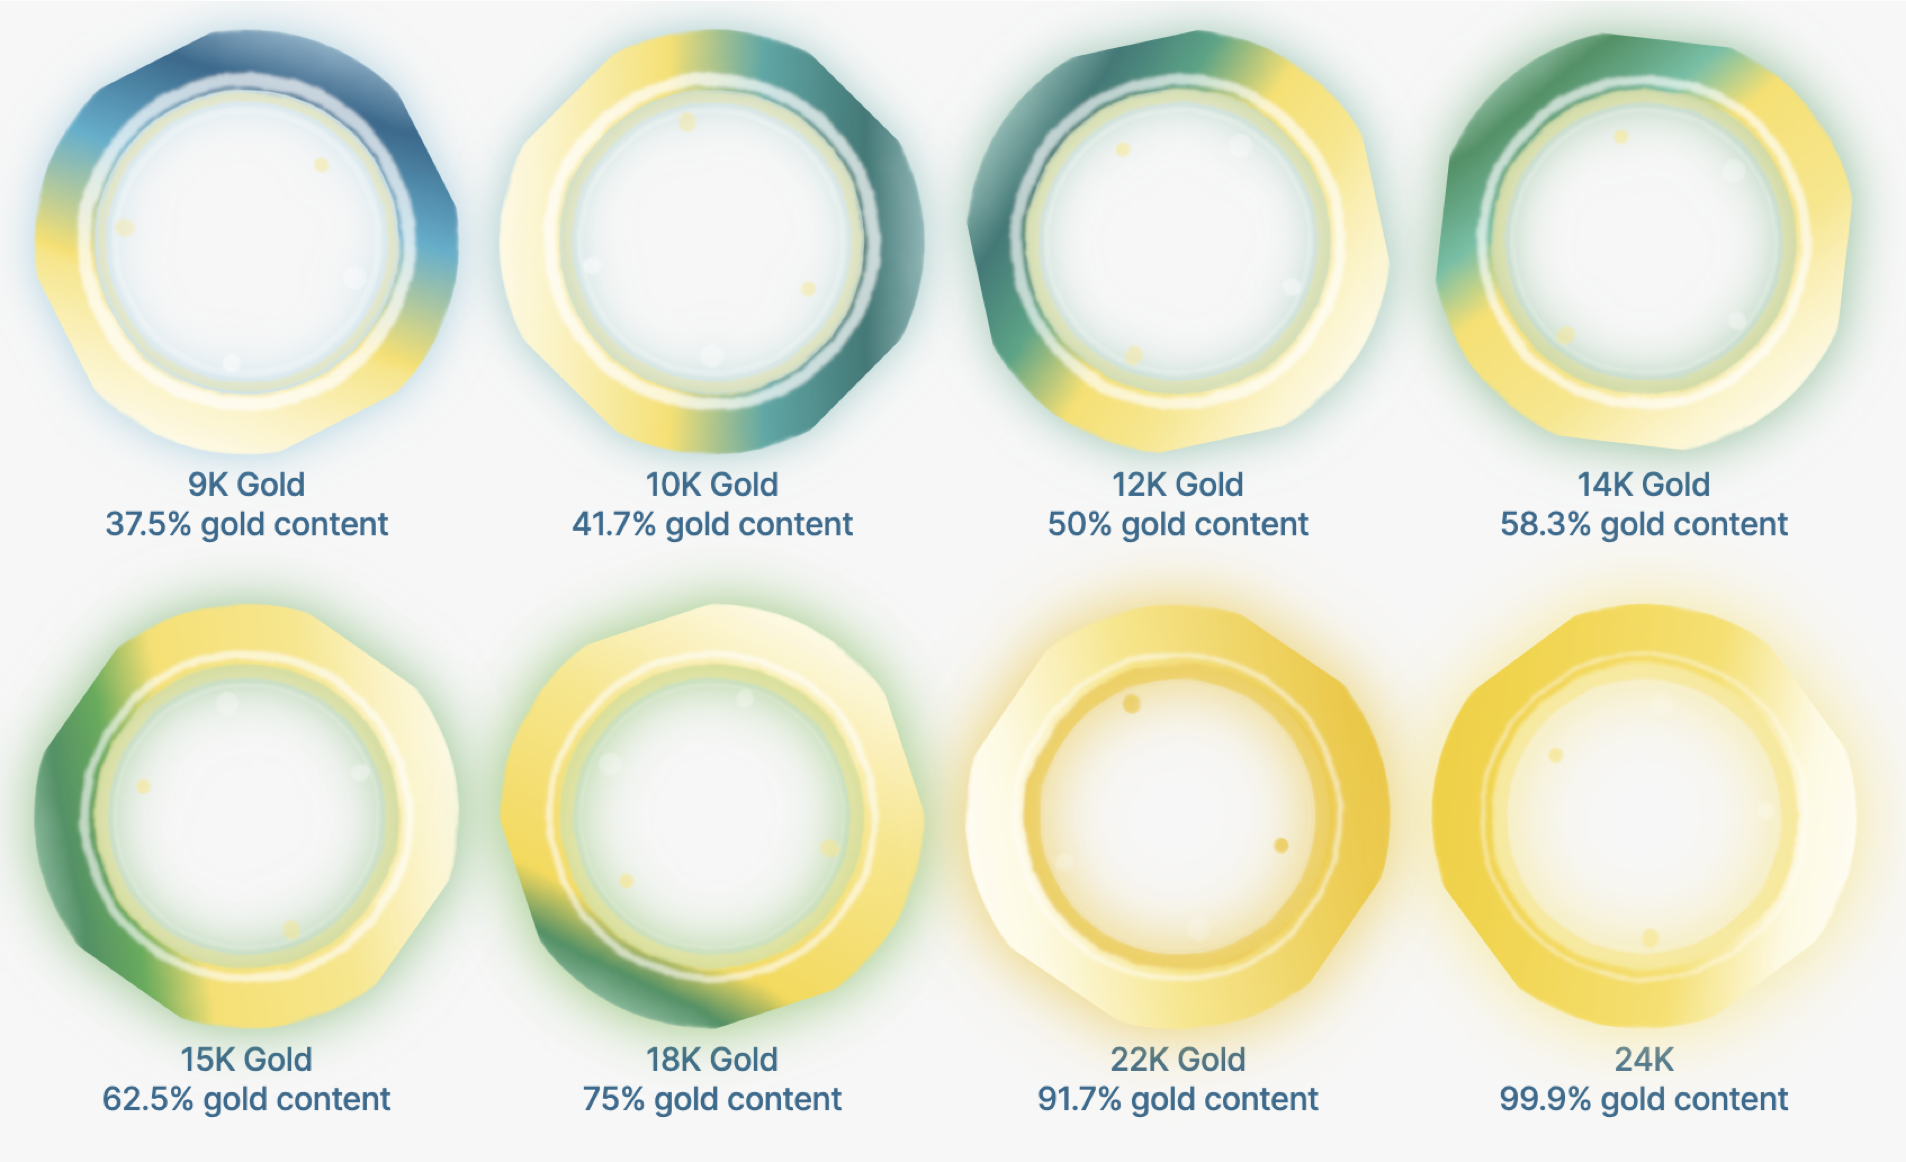
History of Gold Purity
How gold purity developed from 3100 BCE to current times.
View Project →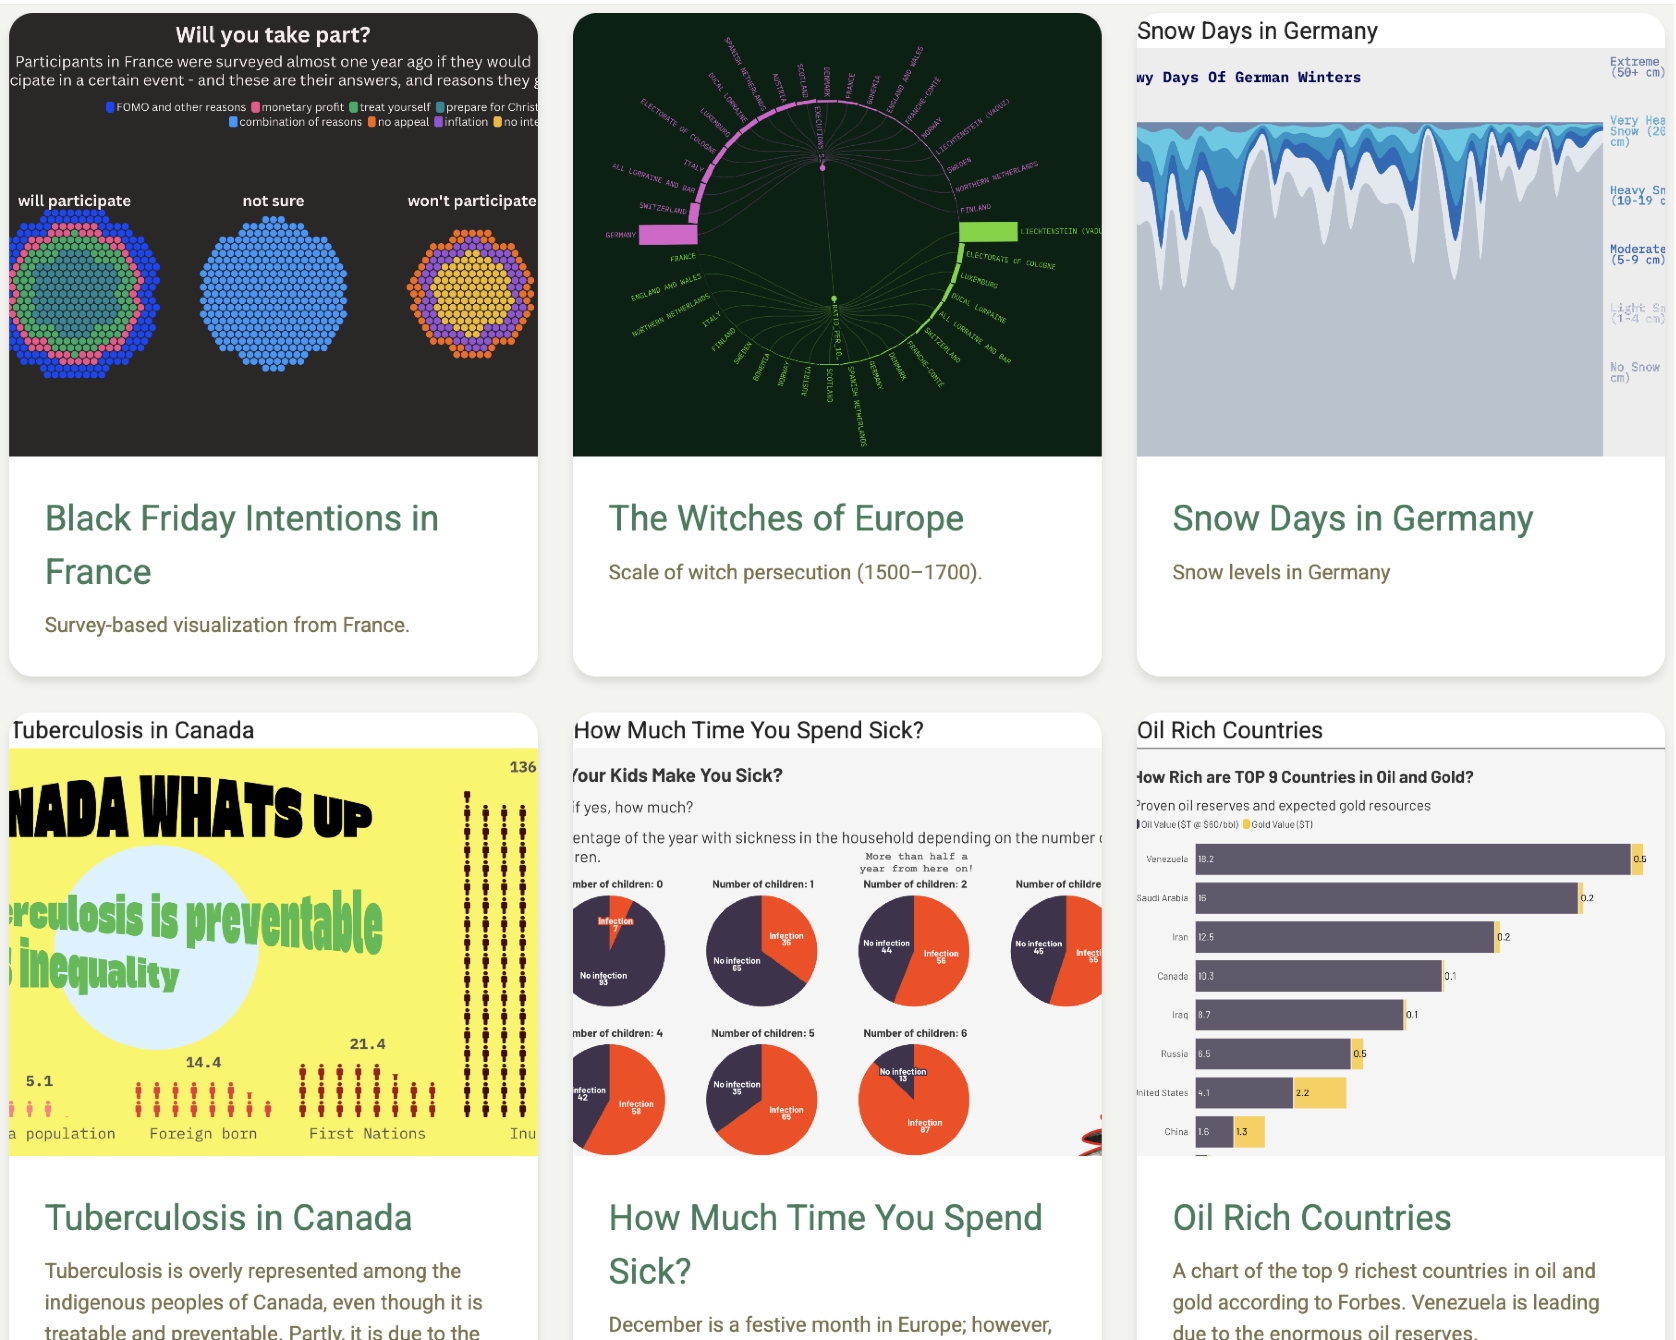
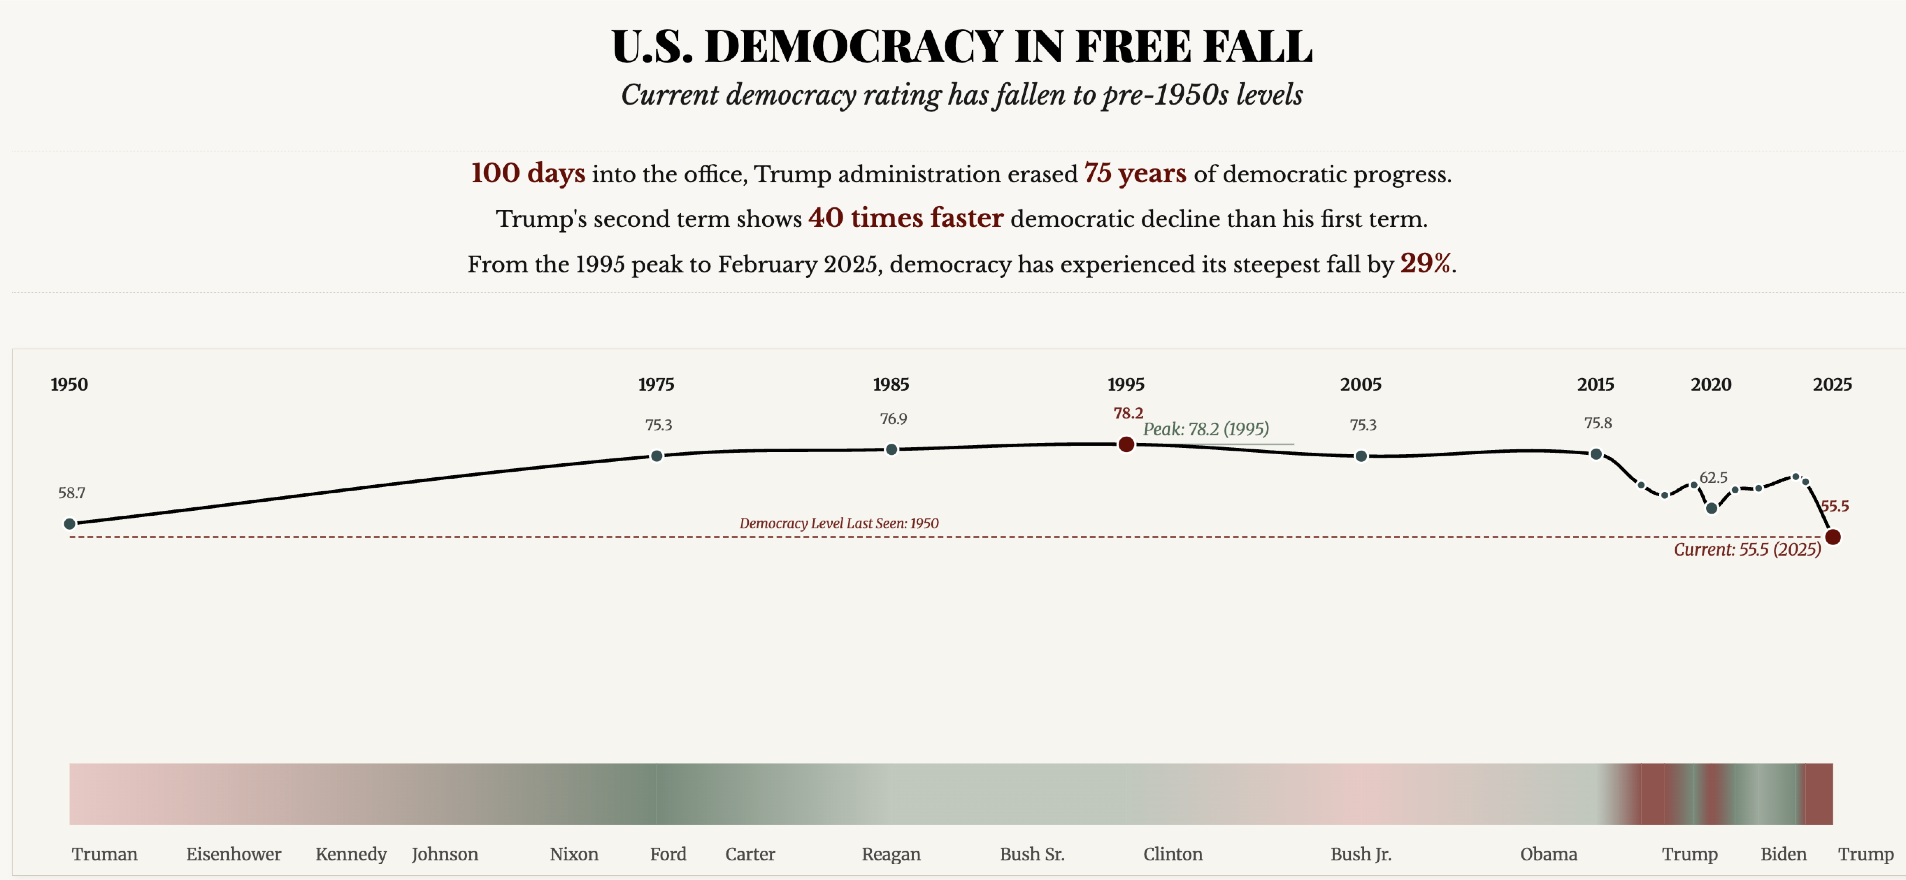
Single Visualizations
A curated collection of standalone visual explorations and editorial charts.
View Project →